See Everything. Act Fast. Sleep Better.
Keep eyes on your entire infrastructure from a single pane of glass. Get instant email or SMS alerts the moment something goes wrong. Our real-time dashboard turns raw metrics into clear insights so you can spot trends, troubleshoot faster, and keep everything running smoothly.
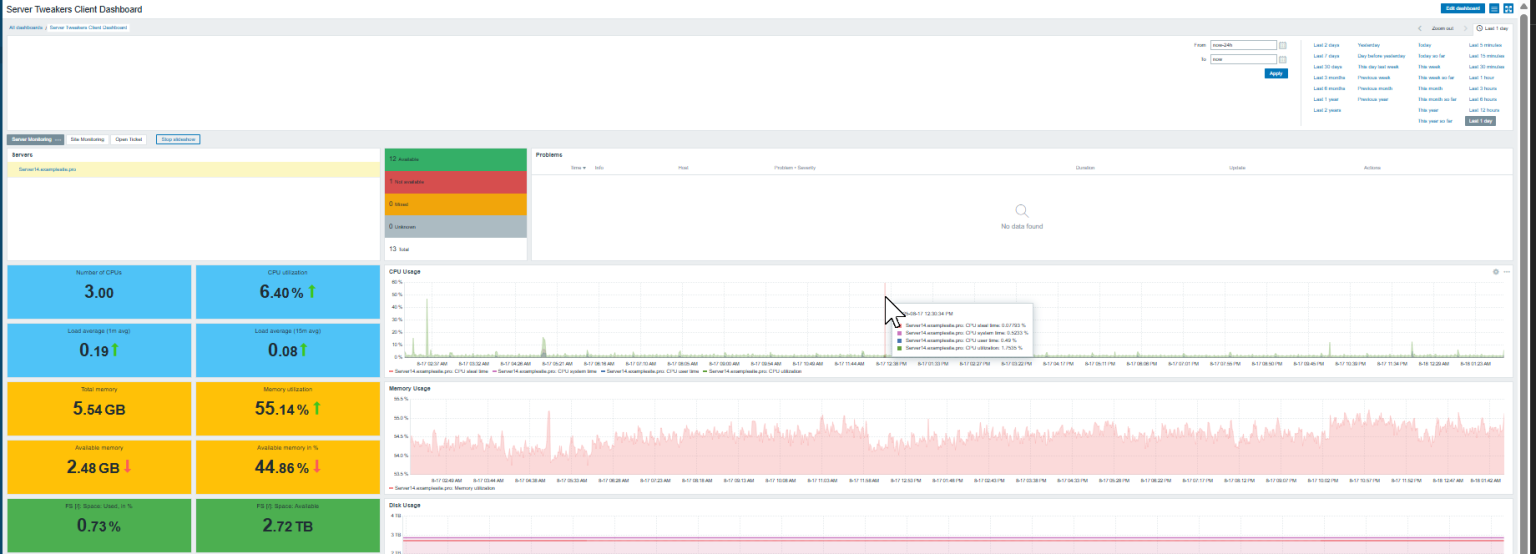
Zabbix Dashboard.
Self Monitoring or Managed Monitoring?
Self Monitoring
You get the full dashboard and instant alerts—your team handles the response and remediation. We are still available by ticket if you need help!
Managed Monitoring
We’re your first responders: when an alert fires, our engineers triage, attempt to fix the issue, and keep you updated. For larger changes, we propose a plan and execute with your approval.
What Do We Monitor?
System Stats
- CPU Utilization
- File System Utilization
- Disk Utilization
- Memory Utilization
- Inodes
- Network Interfaces
- Load Average (1m, 5m, 15m)
- File Descriptors
- Running Processes
- Installed Packages
- System Boot Time
- System Uptime
Agent & Services
- HTTP / HTTPS
- SSH
- MySQL
- IMAP / POP3 / SMTP
- NTP / NNTP
- FTP / Telnet
- Apache / NGINX
- Tomcat / PHP-FPM
- cPanel / DirectAdmin
- HAProxy
Add‑On & Integrations
- Docker
- Elasticsearch
- Kubernetes
- MongoDB
- RabbitMQ
- GitLab Repo
- GitHub Repo
- Custom Scripts & Webhooks
Looking for more? Reach out and let us know what you are looking for. Our team can work with you to set up or build custom checks.
Real-Time Dashboards & Actionable Alerts
We rely on Zabbix for robust, scalable monitoring. Embed live graphs in your portal or use our shared dashboards. Alerts are tuned to reduce noise and highlight what matters.
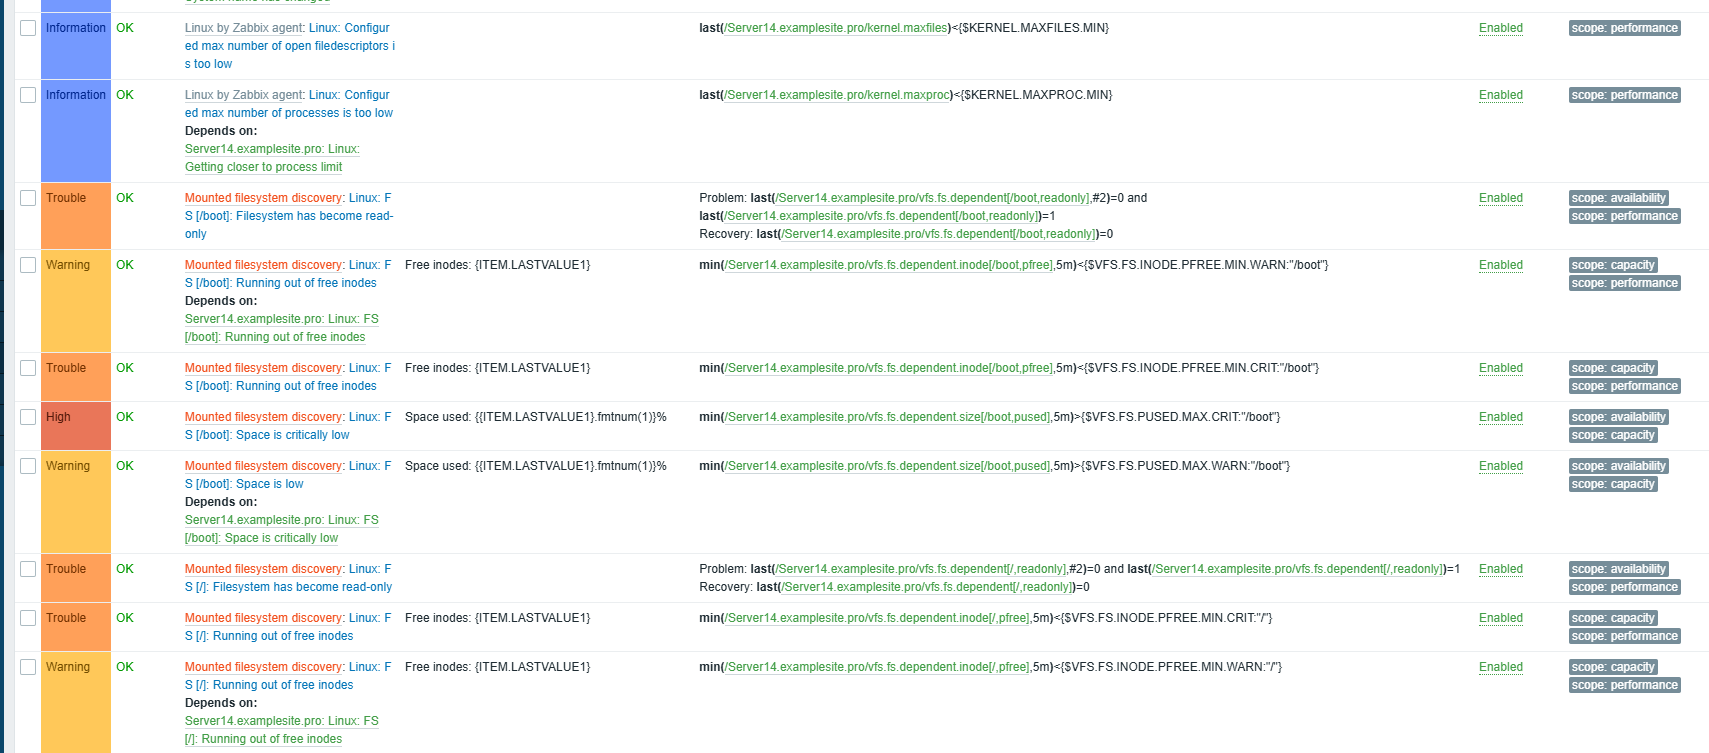
Zabbix triggers
Let’s Monitor What Matters
Choose Self or Managed Monitoring and we’ll tailor checks to your stack. Want something custom? We’ll build it.